Bottlenecks in the warehouse are constraints that limit the overall throughput of a process. They often only become visible once orders start piling up, backlogs build, or staff have to be reassigned at short notice. And the root cause usually isn't in the process step where the problem shows up — it sits further upstream.
A pile-up in picking, for example, can be triggered by missing replenishment, unclear priorities, or delays in goods receipt. For logistics managers in mid-sized warehouses, the key isn't looking at individual workstations in isolation. It's keeping an eye on the entire flow of materials and information.
This article covers:
how bottlenecks in the warehouse develop
which KPIs matter most for bottleneck analysis
how to tell symptoms apart from causes
what a warehouse KPI dashboard needs to deliver
how a warehouse management system supports analysis and control
Management Summary
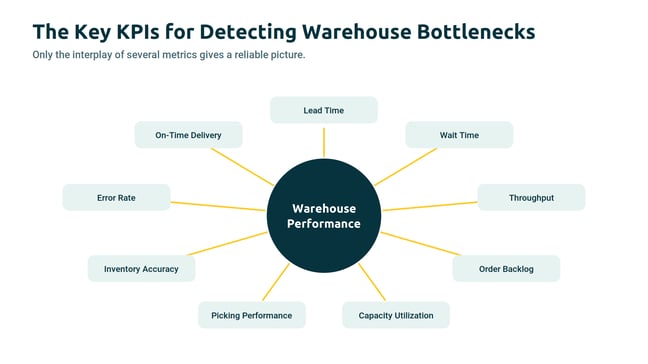
Bottlenecks occur when the capacity of a process step isn't enough to handle the actual inflow over time. But you'll rarely spot one by looking at a single metric. It takes the interplay of throughput, backlog, lead time, wait time, utilization, inventory accuracy, and error rate to reveal where material flow is stalling.
A warehouse management system provides the data foundation for this. It connects process, time, and movement data, allowing detailed analysis by storage zone, shift, order type, or priority. That lets managers catch bottlenecks early, narrow down their causes, and evaluate countermeasures with confidence.
Why Bottlenecks surface so late
A bottleneck is the process step with the lowest effective capacity relative to inflow. It caps the maximum throughput of the entire system. In practice, though, that constraint isn't always located where the disruption first becomes visible.
An example: A warehouse releases 600 order lines per hour but only processes 520. After two hours, a backlog of 160 lines has already built up. Even so, picking isn't automatically the real cause. Orders may be arriving unevenly from the ERP system, replenishment may not be available on time, or certain items may not be in their designated storage location.
Common reasons bottlenecks stay hidden:
fluctuating order volumes
missing real-time data
manual postings
misaligned prioritization rules
unclear responsibilities
local optimization within individual areas
reliance on averages that are too coarse
Which KPIs actually help
Metrics only become KPIs when they're tied directly to a goal or a management question. For bottleneck analysis, the most relevant figures are those that look at throughput, time, quality, and capacity together.
Connecting several metrics is what matters. A high picks-per-hour figure says little on its own if error rates and rework are climbing at the same time. Local performance appears to improve while overall performance gets worse.
In short: A high value isn't automatically a good value. Process context is what counts.
For mid-sized warehouses, these KPI groups have proven their worth:
lead time and wait time
throughput and backlog
capacity utilization
picking and processing performance
inventory quality
error rate and rework
on-time delivery and service level
Warehouse Metrics worth tracking
KPI
What it measures
Warning sign
Order lead time
Time from order release to completion
Rising values with an unchanged order mix
Wait time
Time without active processing
Growing queues in front of individual process steps
Throughput
Orders, lines, or units processed per period
Throughput fails to keep pace with rising inflow while backlog or wait time grows.
Order backlog
Orders released but still open
Steady buildup of aging open orders
Picking performance
Picks per hour or per labor hour
Declining performance under comparable conditions
Capacity utilization
Capacity used relative to capacity available
Sustained utilization near 100 percent (problematic in practice, because there's no spare capacity left to absorb variation).
Inventory accuracy
Match between system and physical stock
Falling inventory accuracy or widening gaps between system and physical stock
Error rate
Faulty transactions relative to all transactions
More rework, returns, and corrections
On-time delivery
Share of orders completed on schedule
Falling service level despite stable volumes
These metrics are especially useful when broken down by storage zone, shift, order type, or product group. That's the only way to tell whether a problem is local, seasonal, or systemic.
Reading Order Lead Time correctly
Order lead time covers the period from the release of an order to its completion. It's one of the most important metrics because it rolls up several process steps and shows how long an order actually stays in the system.
For analysis, the average alone won't cut it. A mean of 45 minutes may look harmless even though 20 percent of orders sit for more than two hours. So you should also look at the median, the maximum, and the distribution by order type or priority.
Bitergo case study: The Bitergo case study on order processing at RHEGARTEX Wohnkultur shows how end-to-end data exchange supports warehouse processes. Customer orders are transferred into the ERP system and passed from there to the Bitergo WMS. The WMS generates a picking order from every customer order. Once picking is complete, shipments are packed and the delivery note data is sent back to the ERP system via the EDI interface.
This end-to-end flow is exactly what makes the case interesting from a KPI perspective: it exposes lost time, manual intervention, and media breaks. The reference shows very clearly how lead time, workload, and process reliability improve with an integrated warehouse and system architecture. >> More details in the Rhegartex case study
The key point: Averages alone aren't enough for bottleneck analysis. Only the distribution shows where time is lost.
Look at Throughput and Backlog together
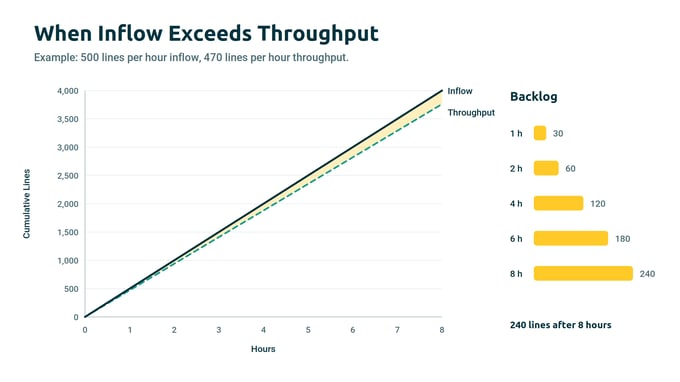
Throughput tells you how many units or orders get processed in a given period. It only becomes meaningful when compared to inflow. If 500 lines are released per hour but only 470 are completed, the backlog grows by 30 lines every hour. That seems modest at first, but it adds up to 240 lines over an eight-hour shift.
A bottleneck is especially likely when several signals appear at once:
inflow is rising,
throughput stays flat,
wait time is increasing,
backlog is growing,
on-time delivery is slipping.
Here, too, differentiation is essential. A backlog of 80 open orders means something very different if 70 of them have only been open for ten minutes than if 20 of them have been waiting for hours.
Keep in mind: Throughput is only meaningful in relation to inflow.
Judging Picking Performance in Context
Picking is one of the most labor-intensive areas in many warehouses. That's why picks per hour is such a popular performance indicator. But the figure only holds up when the underlying conditions are comparable.
Low performance can have causes such as:
long travel distances,
missing replenishment,
frequent interruptions,
varying order sizes,
poor item placement,
a high share of single-line orders,
inaccurate stock data.
Example: One zone hits 110 picks per hour, another only 78. Without further breakdown, that's nearly impossible to interpret. But if the second zone has longer travel distances, more bulky goods, and a higher error rate, the problem isn't staff performance — it's the layout of the zone.
Any assessment should therefore account for at least storage zone, order type, shift, and error rate.
Which means: Picking performance is only comparable when process conditions are similar.
Utilization is not the same as Efficiency
Capacity utilization measures capacity used against capacity available. For staff, conveyor systems, pack stations, or dock doors, high utilization may look like good news at first. In a low-variability process, 85 percent utilization can run perfectly stable. In a highly volatile environment, the same figure can already create wait times.
It becomes a problem above all when:
inbound volumes fluctuate heavily,
there are no buffers in place,
setup or changeover times are long,
there's critical dependency on individual resources,
short-term peaks can't be absorbed.
For day-to-day control, then, averages aren't the only thing that counts — peak loads and how long overload persists matter too. An area running at its capacity limit for 90 minutes every day carries a different risk than one with even utilization throughout the day.
The key point: High utilization isn't automatically a sign of good performance. It can also put stability and service level at risk.
Inventory Accuracy as a Performance Factor
Inaccurate stock data isn't just a data problem. It slows material flow and creates unnecessary work. When an item exists in the system but not on the shelf, you get search efforts, manual clarification, or unplanned replenishment.
Typical consequences:
failed picks,
extra travel,
interrupted orders,
inventory corrections,
mispicks,
delays in downstream processes.
This gets especially critical with fast movers. If an item with 200 picks per day is only recorded correctly in the system 95 percent of the time, that alone can cause several disruptions per shift. So inventory quality shouldn't be tracked only as an overall rate, but also by product group, storage zone, and type of error.
Important: Inventory accuracy affects more than data quality — it drives throughput directly.
Error Rates and Rework: The hidden Bottlenecks
High performance is only worth something if it isn't paid for with rework. When the error rate climbs, the effort typically shifts into packing, quality control, returns processing, or customer service.
That can look like this:
8 percent of orders require rework,
the return rate rises,
pack stations get tied up with corrections,
delivery dates are missed despite high throughput.
So a warehouse can technically process more orders and become less efficient at the same time. That's why errors shouldn't just be counted — they should be broken down by cause, process step, and point of origin.
Put simply: Rework consumes capacity and acts as a hidden bottleneck.
Reading KPIs in Context
Individual metrics lead to wrong conclusions fast. Only the combination reveals whether a process is genuinely healthy.
Example 1: Picks per hour rise by 15 percent. At the same time, the error rate climbs from 1.8 to 4.2 percent, and rework in packing grows by 30 percent. In that case, the productivity gain is positive in appearance only.
Example 2: Goods receipt runs at 95 percent utilization, but putaway can't keep up. After two hours, 180 pallets are backed up in the transfer zone. The bottleneck isn't in receiving — it's in the downstream process.
Which means: Local peak numbers only make sense when the process as a whole benefits from them.
In a nutshell: KPI analysis is always process analysis, not just number-watching.
A Dashboard that actually drives Decisions
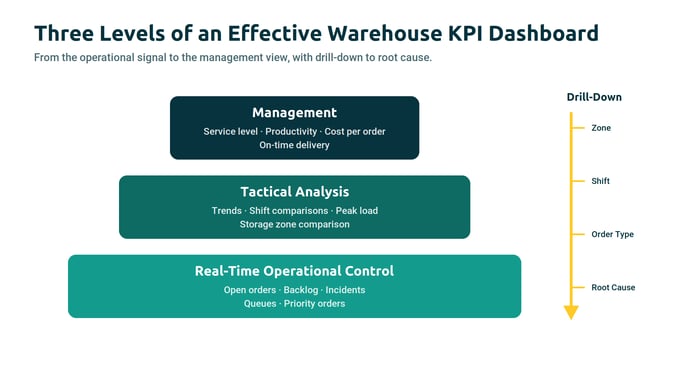
A warehouse KPI dashboard shouldn't be a data collection — it should be a control instrument. That takes three levels:
real-time operational control covering open orders, backlogs, and disruptions,
tactical analysis with trends, shift comparisons, and utilization peaks,
a management view with service level, productivity, and cost per order.
Drill-down logic is critical. When on-time delivery drops, the dashboard has to show whether the cause sits in a zone, a shift, or an order type. That's what turns a report into a real management tool.
The key point: A good dashboard shows more than values — it shows the cause behind the deviation.
The WMS as a Data Foundation
A warehouse management system supplies the timestamps and movement data this analysis requires: release time, processing start, status changes, stock movements, error messages, and completion times.
That makes it possible not just to calculate metrics, but to trace them back to their causes. You can see how long orders spend waiting, being processed, or sitting in handover.
The Bitergo WMS builds this foundation by capturing inventory, goods movements, and operational process steps in real time and linking them together. Built-in reporting functions let you analyze the data by criteria such as storage zone, order type, or priority. That reveals where wait times build, where backlogs grow, and where actual performance diverges from targets. On that basis, managers can do more than spot bottlenecks — they can narrow down the causes and derive the right countermeasures.
How meaningful the metrics are, however, depends on data quality. When postings happen late or manually outside the system, gaps appear in the analysis. A WMS can improve transparency substantially, but it requires clearly defined processes that are consistently followed.
Keep in mind: A WMS creates the data foundation. It doesn't replace process discipline.
From Measurement to Action
Once a bottleneck has been identified, the next step is root cause analysis. A workable approach:
Locate the bottleneck.
Identify the affected process steps and orders.
Separate cause from symptom.
Prioritize countermeasures.
Verify the effect against the KPIs.
Possible measures include changing order release, improving replenishment control, assigning staff dynamically, or optimizing item placement. But a measure is only successful if it improves overall throughput without creating a new bottleneck somewhere else.
Important: Always evaluate measures against the system as a whole, not just the individual workstation.
Conclusion: Catching Bottlenecks early with KPIs
You can't read a warehouse bottleneck off a single metric. What matters is looking at throughput, inflow, backlog, wait times, utilization, inventory quality, and error rate together. That's how you see whether an area really lacks capacity or whether the cause lies in order release, replenishment, or inaccurate stock data.
A WMS provides the process and movement data required for this and helps managers detect deviations, analyze causes, and verify the impact of their optimization measures.
Tip: A no-obligation consultation with Bitergo can be a good starting point for exploring where you could gain more transparency, better control, and earlier bottleneck detection in your warehouse.
Part 3 of our mini-series: Not all dark stores are the same. Efficiency for unmanned warehouses and e-commerce picking warehouses
Dieter Sellner
Feb 17, 2026
Get notified on new marketing insights
Be the first to know about new B2B SaaS Marketing insights to build or refine your marketing function with the tools and knowledge of today’s industry.